distribution of cafes pwer barangay in quezon city
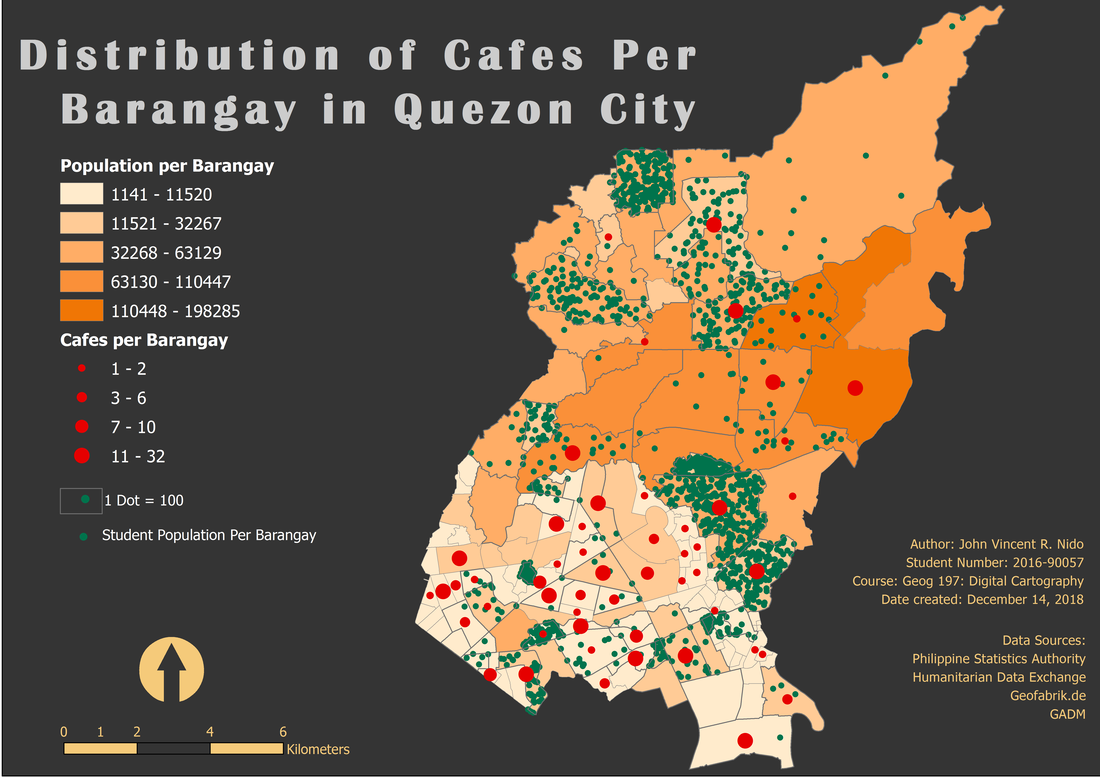
The purpose of the map is to show the distribution of cafes (be it an international retail chain, or a locally-established shops) in different barangays in Quezon City.
The data that I have collected coming from the different sources with the help of my mentor as well, Geoff Tugade. First, the number of coffee shops present in Quezon City, was obtained through HDX Philippines wherein I filtered ‘cafes’ among the attributes. Data then is somewhat problematic as I may say, since there are shops which were tagged as cafes but in reality they are pizza parlors, bakeshops and etc. Second, was the data for QC boundary (which was given by Sir Geoff, as the file that I previously have, got some mismatch so we made sure that every points will fall into the right places). The data of the school as well came from Sir Geoff which includes the population as per AY 2016-2017 which he used then in his previous projects. The last one is the Barangay population which I obtained from PSA.
To be honest, the process of creating the output was brain-wrecking (lol) maybe it's about the data that I have, or through some processes that I have to do. The choropleth map shows the population of each barangays in Quezon City, next is the graduated symbol dot wherein it shows the number of cafes present in each barangays and the dot density is the population of the students present in each barangay. I really tried to gather and obtain a land use data of Quezon City, with the help of my Mentor, be it online or with the people he knew from QC government office however, we cannot find anything nor received any response. This data is to enhance the totality of the map appearance such as the impact of the output to the audience which will give them idea on as to why there was an aggregation of this cafes in the said barangays. Aside from that, I also got difficulties of representing the data since I have different data on hand and in the map itself and it seemed that there are many things that’s happening on it.
For those who wanted to be a mapper or a cartographer, in dealing with the topic that you want to map on, or when you are to start with the project (be it as an academic output or something that got your interest) please make sure that you have researched for it very well, like inspirational maps that you could get some idea on how would you represent and show your data. I would also advice that whenever you already have the data on hand, made sure to review on that to get some realizations on what other aspects you can put in the map not just to enhance aesthetics but to modify the information you would want to present to help the audience to easily understand the map. And lastly, take breaks and have some rest whenever necessary, this will help your brain to function properly that could bring bright ideas that you could incorporate to your map. Enjoy mapping!
