ten most flood-vulnerable barangays in quezon city
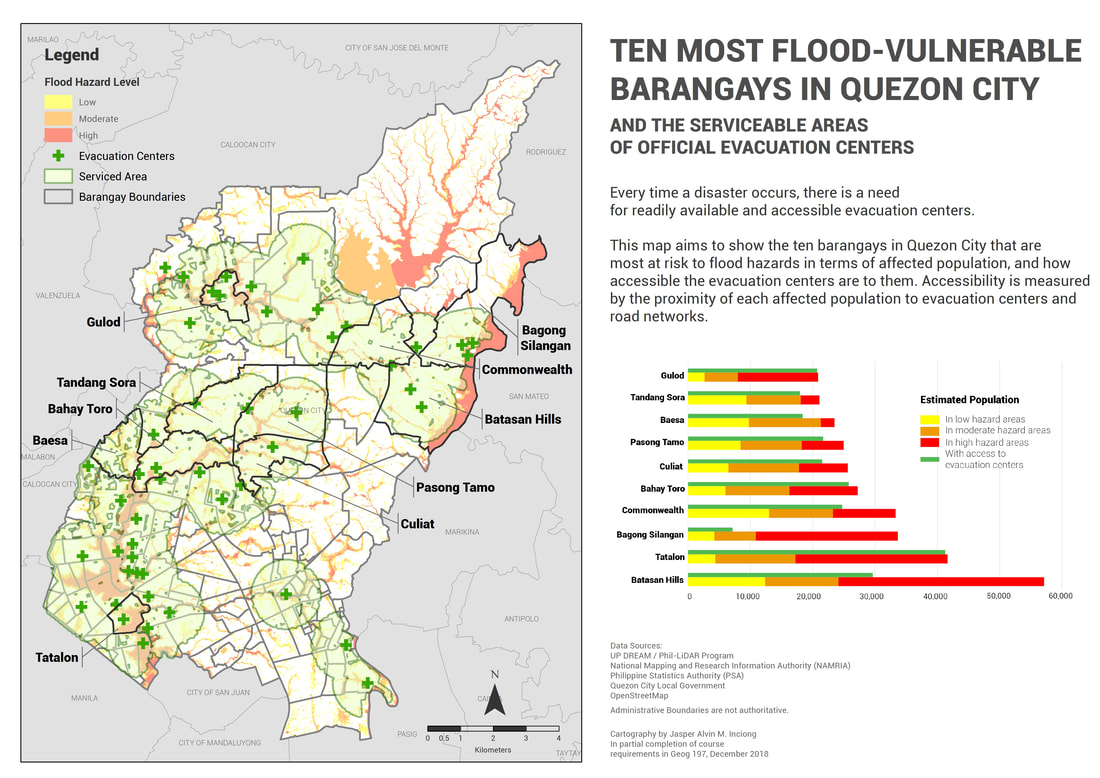
The initial purpose of the map is just to visualize the location of evacuation centers in Quezon City and the flood hazard level of each barangay. However, along the mapping process, I thought about including the affected population as well as the accessibility of each evacuation centers. The reason behind why I decided to make this map is because of the reports of overcrowding in evacuation areas during and after calamities which made me skeptical if there is actually enough and accessible evacuation centers given that the country is vulnerable to natural hazards.
The key data that are flood hazard data of Quezon City from LiPAD, the website of Phil-LiDAR Program which shows the areas with flood hazards that are divided into low, moderate, and high level, barangay population from the Philippine Statistics Authority (PSA), and the data, which is only nominal, of official evacuation centers from the website of Quezon City local government. The primary step in making the map is of course the creation of necessary shapefiles. Overlay analysis was used in order to determine the affected population that are at risk to flood hazards and identify the barangays that are most flood-vulnerable. Buffer analysis on evacuation centers and roads was used in order to identify the accessibility of the evacuation centers and derive the number of the affected population that are serviced by them.
Some of the challenges in creating the map was that it was tiring to make and the small amount of time remaining to complete the project. However, the most challenging part of creating the map is the question on how would I show its main purpose with the given data. I am thankful enough that an expert like Mr. Rienzi Velasco was my map mentor who was patient enough to teach me different kinds of data analysis that helped me derive the necessary information needed to portray the true purpose of the map.
An advice that I would give to beginner mappers is to choose a theme for the map that you really want as early as possible and make sure that there are available data sources for it. Exploring the GIS software that you are using would also give you an advantage.
