passengers & capacity in the philippines' top 10 busiest airports, 2017
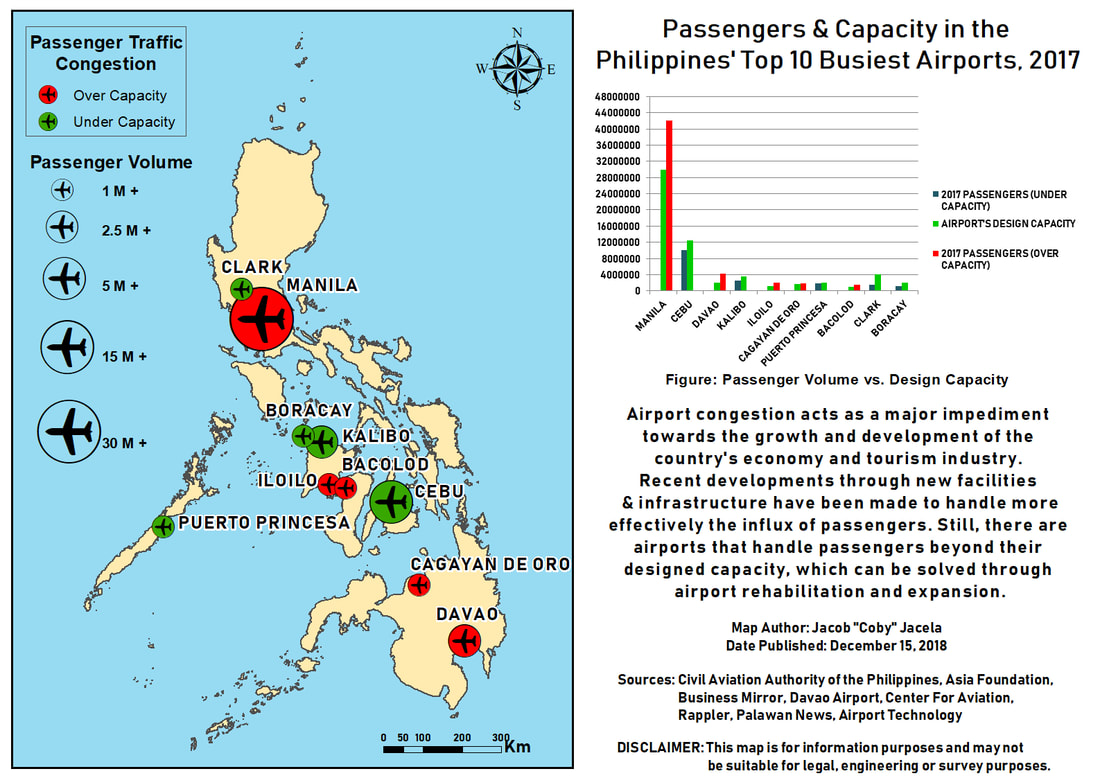
The map aims to provide a cartographic representation of the Philippines’ 10 busiest airports in terms of passenger traffic (2017) together with the aspect of airport congestion. These ten airports provide a sample of the overall situation of Philippine airport congestion, wherein half of the airports serve more than what they are intended to handle. Given the continuous rise in passengers passing through Philippine airports due to growth in business and tourism, the need to improve airport facilities and infrastructure is essential for further growth and development in the country's economy and aviation industry. Overall, the purpose of the map is to inform and or remind its target audience - the Philippine government, aviation industry, and the general
public - of the airport congestion situation, specifically on the developments in some airports and the problems that have yet to be solved in others.
In creating the map, I collected tabular data about the passenger statistics of the ten airports from the Civil Aviation Authority of the Philippines database. I also collected quantitative data on the designed / intended capacity of the airports through different online references related to news on Philippine aviation. Obtaining the latter proved to be more challenging since no one
reference can provide all ten airport’s intended capacity, unlike the former which displays all airports’ statistics in just one source. I started making the actual map with a blank map of the Philippines. Then, I pinpointed the location of the ten airports by displaying the X-Y data,
represented through the coordinates of the airports. I then changed the symbology of these airports by adjusting their sizes based on passenger volume and their color based on accordance with design capacity, which was done using multiple attributes (quantity by category). And finally, I labeled the airports not through their actual names, but on the general area / place that they serve, since I believe these places would be more recognizable for the public. In addition to the map proper, I also added a graphical illustration of the data to provide an alternative way of understanding what is said in the map, without detracting focus from the map itself.
The creation of this map came after making several maps that detail passenger statistics of the Philippines’ busiest airports for the past three years. These maps provided a visualization of these airports, the number of passengers they handled, and the percentage growth year after year. But the challenge for me was how to tell a story about an issue through a map, instead of
simply showing information and statistics. I felt discouraged about how I could not find a new story to tell with the data I have because I was not able to find a relevant issue right away. I was simply illustrating statistics through maps which lack depth and substance and could already have been done previously, rendering my maps insubstantial and rehashed. But after realizing
the possible congestion that results from the overall growth in passenger count, I finally found a specific topic about airports that focuses on a particular issue and could be represented in a map. I also recalled how a map is supposed to tell a story without the support of too much words. Limiting the topic to something more specific enabled me to create a simple yet informative map.
After a semester-long experience of being a beginner in digital cartography, my advice for future beginner mappers is simple: do not rush the creation of a map. The end product may sometimes look simple, but the process it undergoes - from the conceptualization of the topic to the layouting and formatting of the map - is actually a complex undertaking. Map makers should
take their time in coming up with a theme that would translate well in a cartographic medium of communicating ideas. The topic could be based on a general idea, but it could be made more specific and could have a particular focus and direction by considering its relevance to the target audience. From there, you could then be creative and unique in illustrating the theme through a map. Always keep in mind the basic elements and design principles of mapping that should guide you in your map execution. It takes time to be proficient in making maps, but with continuous practice and effort in improving your skills, you should be able to capture the essence of cartography - to provide a visual representation of geographic phenomena through a
form of art that proves relevant for its intended audience
